글로벌 에너지 전환 통계
2024년 세계 에너지 자료 및 탈탄소화 지표를 확인하세요
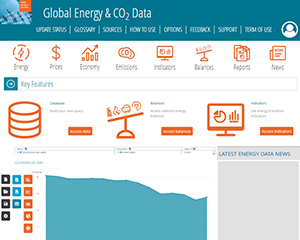
Enerdata의 대화형 데이터 도구에 오신 것을 환영합니다.
2024년 세계 에너지 및 기후 데이터와 주요 탈탄소화 지수에 액세스하고 세계 지도와 그래프를 탐색하여 에너지 산업의 최신 데이터와 동향을 살펴보세요.
다음을 제공하는 독점 에너지 통계에 액세스하세요:
- 포괄적인 데이터 액세스: 석유, 가스, 석탄, 전력, 재생에너지의 생산, 소비, 거래에 관한 데이터와 연료 연소로 인한 CO2 배출량을 살펴보세요.
- 글로벌 범위: 1990년부터 2024년까지 전 세계 60개 국가 및 지역을 아우르는 데이터를 제공합니다.
사용자 친화적인 기능의 이점:
- 애니메이션 데이터 진화: 1990년부터 2024년까지 시간 경과에 따른 추세를 시각화합니다.
- 대화형 지도: 확대/축소 컨트롤로 원하는 지역을 쉽게 선택할 수 있습니다.
- 국가별 벤치마킹: 여러 국가의 데이터를 비교하세요.
- 유연한 기간 선택: 원하는 시간 범위를 선택하여 데이터를 볼 수 있습니다.
- 데이터 내보내기: 전 세계 또는 특정 에너지원별로 데이터를 내보낼 수 있습니다.
최신 에너지 트렌드와 데이터를 탐색하고 앞서 나가세요.

세계 탈탄소화 지표
주황색 수치 : 2024 년 데이터
파란색 수치 : 2023 년 데이터
G20 통계 및 기타 세계 추정치에 근거합니다.
2024 세계 에너지 주요 수치
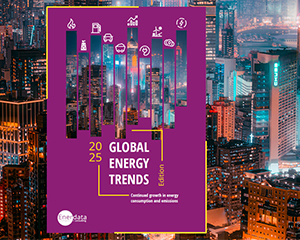
2024년판 글로벌 에너지 트렌드에서는 필수 에너지 데이터에 대한 인사이트를 제공하고, 현재의 추세가 2030년까지 재생에너지 용량을 3배로 늘리고 에너지 효율을 2배로 높이는 것을 지원하는지 확인하기 위해 COP28의 공약을 평가합니다.
간행물 다운로드